

Grist Analytics is a start-up in Boulder, Colorado that focuses on optimizing the fermentation process for breweries of all sizes. The software is currently being used in five countries in both small craft breweries and large international brewing corporations. When I joined this project, the Grist Analytics team had already conducted user research and identified major pain points with the packaging feature of the software. I was brought up to speed on their findings and began my work with defining the problem and key user flows.
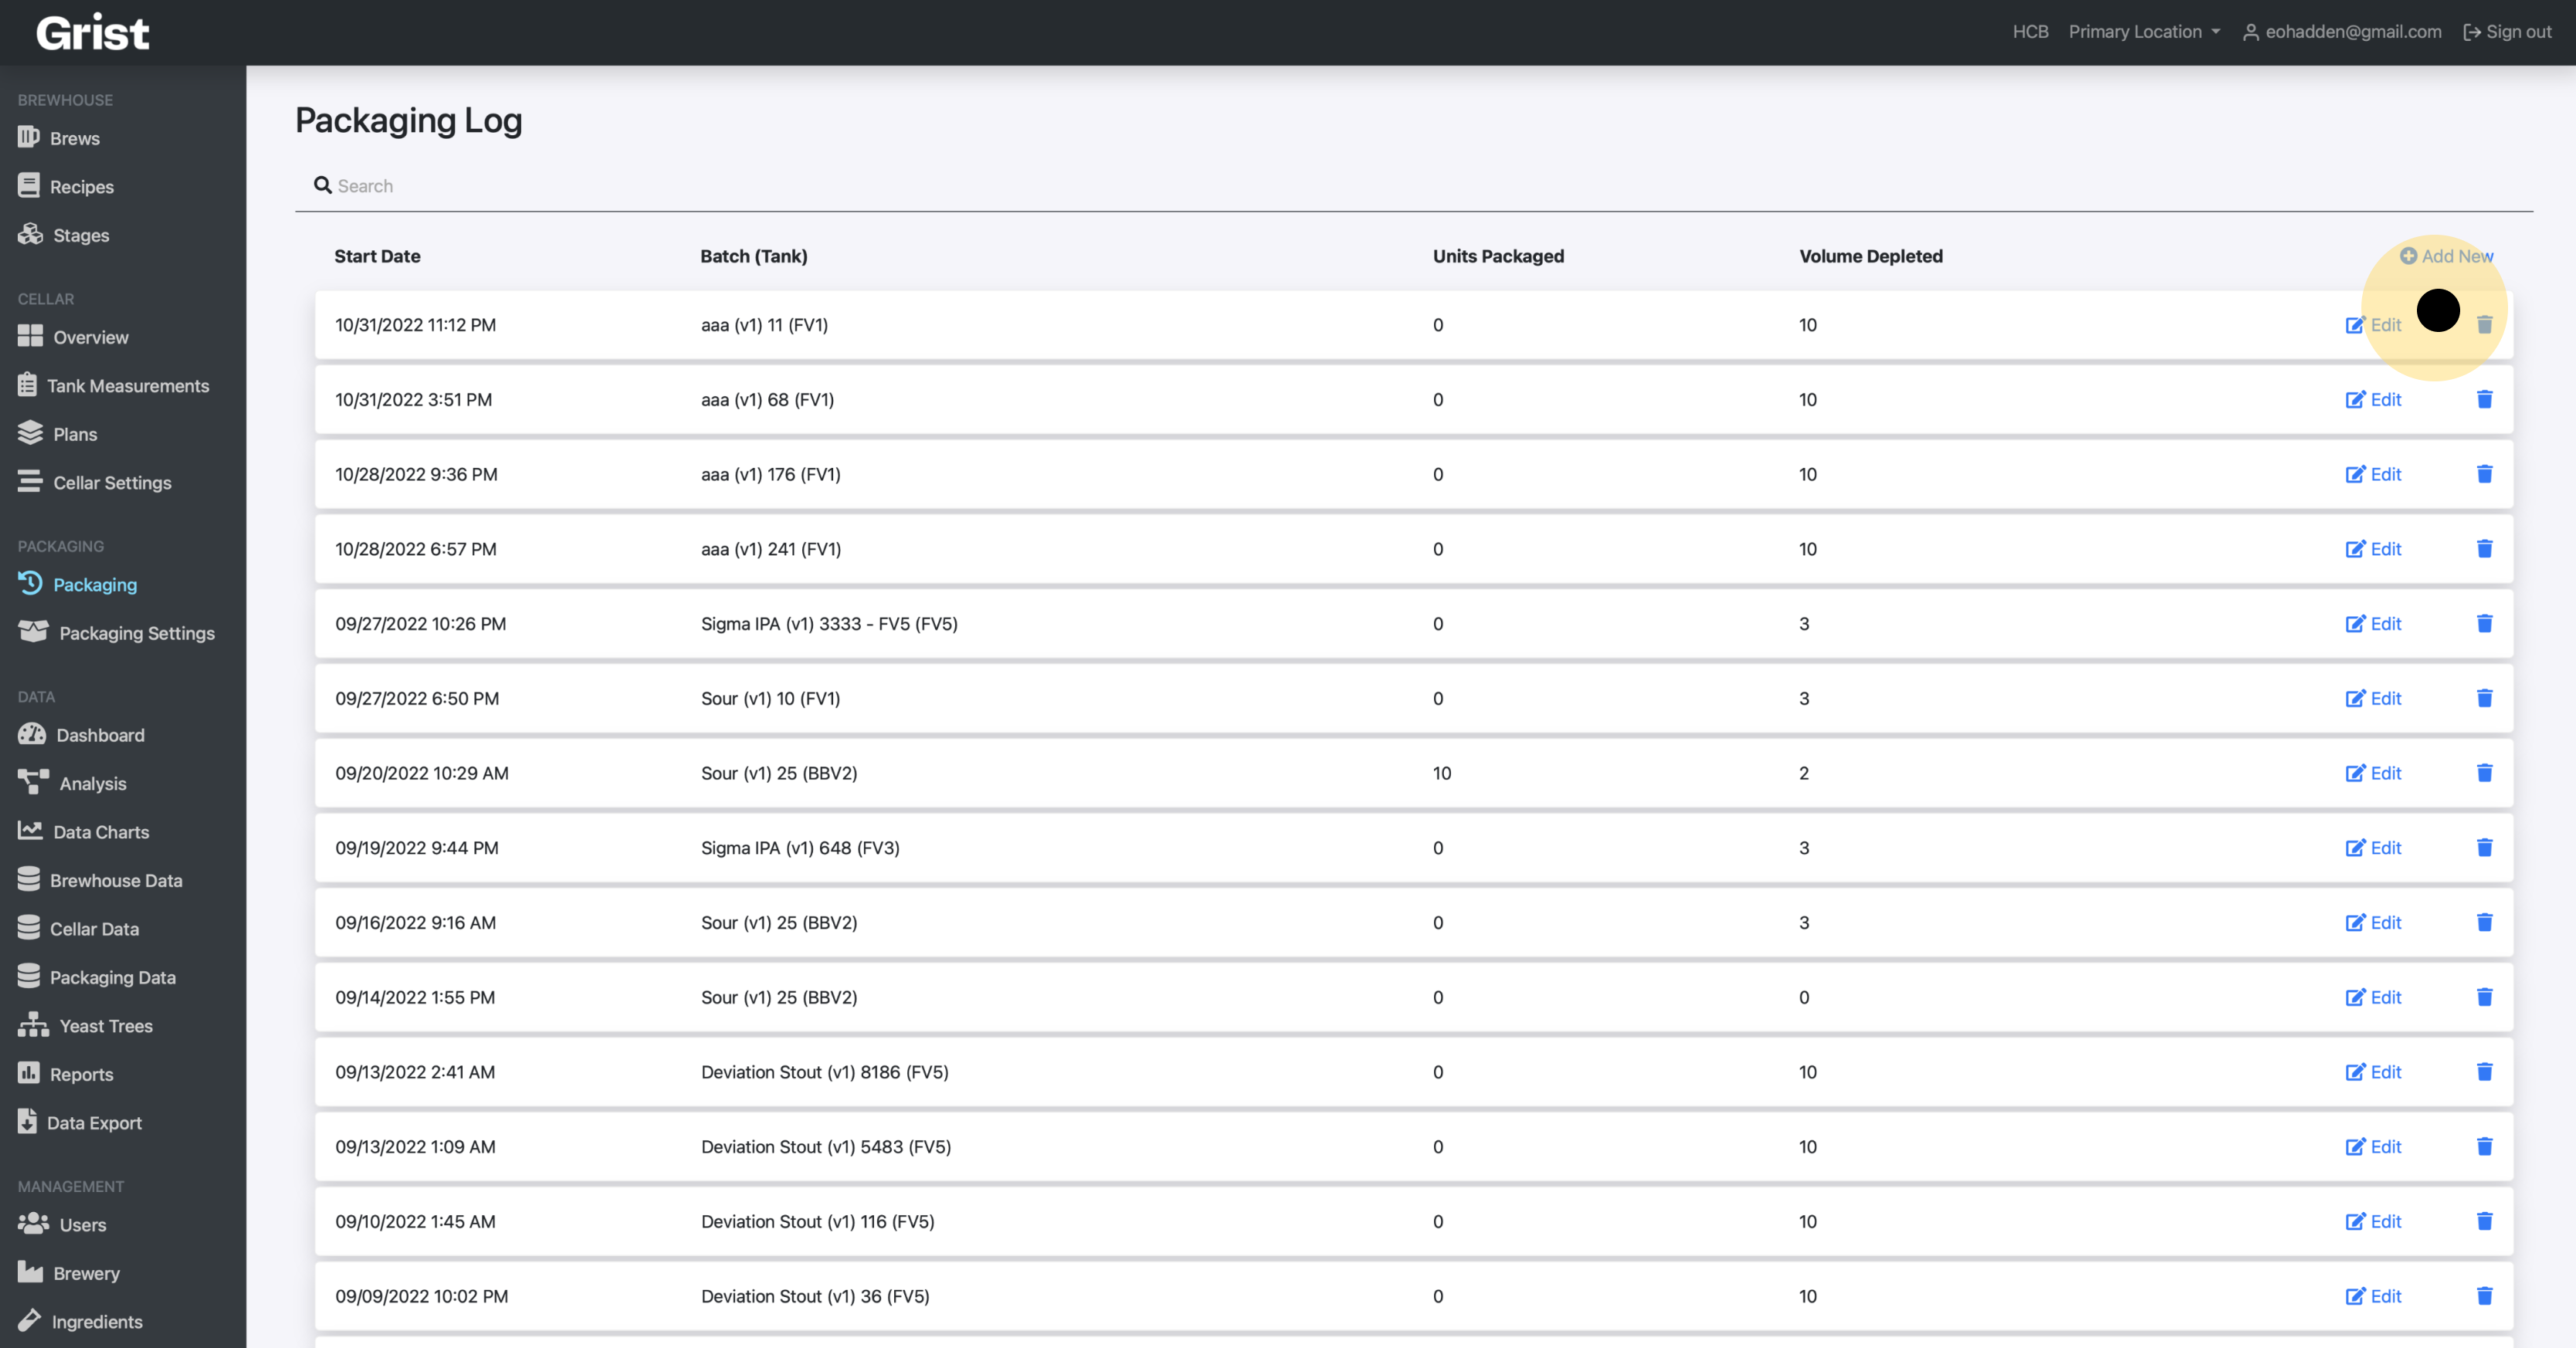
In addition to fermentation data, Grist Analytics software also provides brewers (users) with the ability to record and store important data during packaging. This data includes volume depletion from brew tanks, total amount packaged of each packaging type (12 oz cans, kegs, barrels, etc), and measurements taken during packaging (can seam pressure, CO2, temperature, etc). Google Analytics revealed that most users rapidly bounce off the packaging page. Those that try to use the feature, abandon the process mid-data entry. User interviews helped us gain a qualitative understanding of user complaints. Images below show the original design along with key complaints.
Initially, users were only able to start packaging on one brew tank at a time from one place within the software, the Packaging Page.
Result #1: The redesign will allow users to start packaging from multiple locations within the software.
Result #2: Brewers will be able to start packaging "events" on multiple tanks simultaneously.

When brewers took measurements during packaging, their dashboards would populate with up to fifty columns for data entry. Users reported that the software was unable to handle measurement input on all fifity categories simultaneously.
Result: Measurements will be broken down into "Measurement Sets" to reduce the number of options users view on their screen at a given time.
Every brewery packages their product in different packaging types and corresponding volumes. Restricting packaging types limits the amount of users who could benefit from the packaging feature.
Result: Users will be able to create their own packaging types and set unique corresponding volumes.

Brewers want the ability to compare packaging measurement data to historical values in real time. This information would help them improve quality and yield over time.
Result: Brewers will be able to see how current measurements compare to historical data along with the standard deviation within each measurement while packaging.
Users need a way to easily access and navigate the packaging feature, take measurements and compare their results to historical data points because this will improve their experience with the software and lead to increased use of the packaging feature.
The Grist Analytics team shared the user feedback and research with me and communicated initial ideas for the information architecture of the new packaging feature. From our conversations, I came up with task and user flows.
Overall Task Flow: Start packaging events from multiple locations and conduct measurements on those events.

User Flows: User flows were created to accomplish all project goals.
Allows users to create distinct packaging types, assign units of volume and create measurement sets.
Allows users to start packaging and taking measurements on multiple tanks simultaneously from the Cellar Overview.
Creates a seamless way for users to take packaging measurements and compare them to historical data in order to make timely adjustments.
Working inside constraints
When I joined the Grist team, the software engineers had been responsible for all product design and had not created a comprehensive design system. This led to some outdated design patterns as well as inconsistency across the platform. In addition to redesigning the packaging feature, the CEO asked me to begin development on a comprehensive design system that would modernize their existing brand and help enforce consistency across the software.

Before starting any digital work, we spent weeks sketching out different design patterns to best meet user needs. This process involved constant collaboration with back and front-end developers to ensure we were designing within technical constraints. Over time, these sketches turned into low, then mid-fidelity wireframes that were A/B tested with a handful of willing breweries using Zoom.
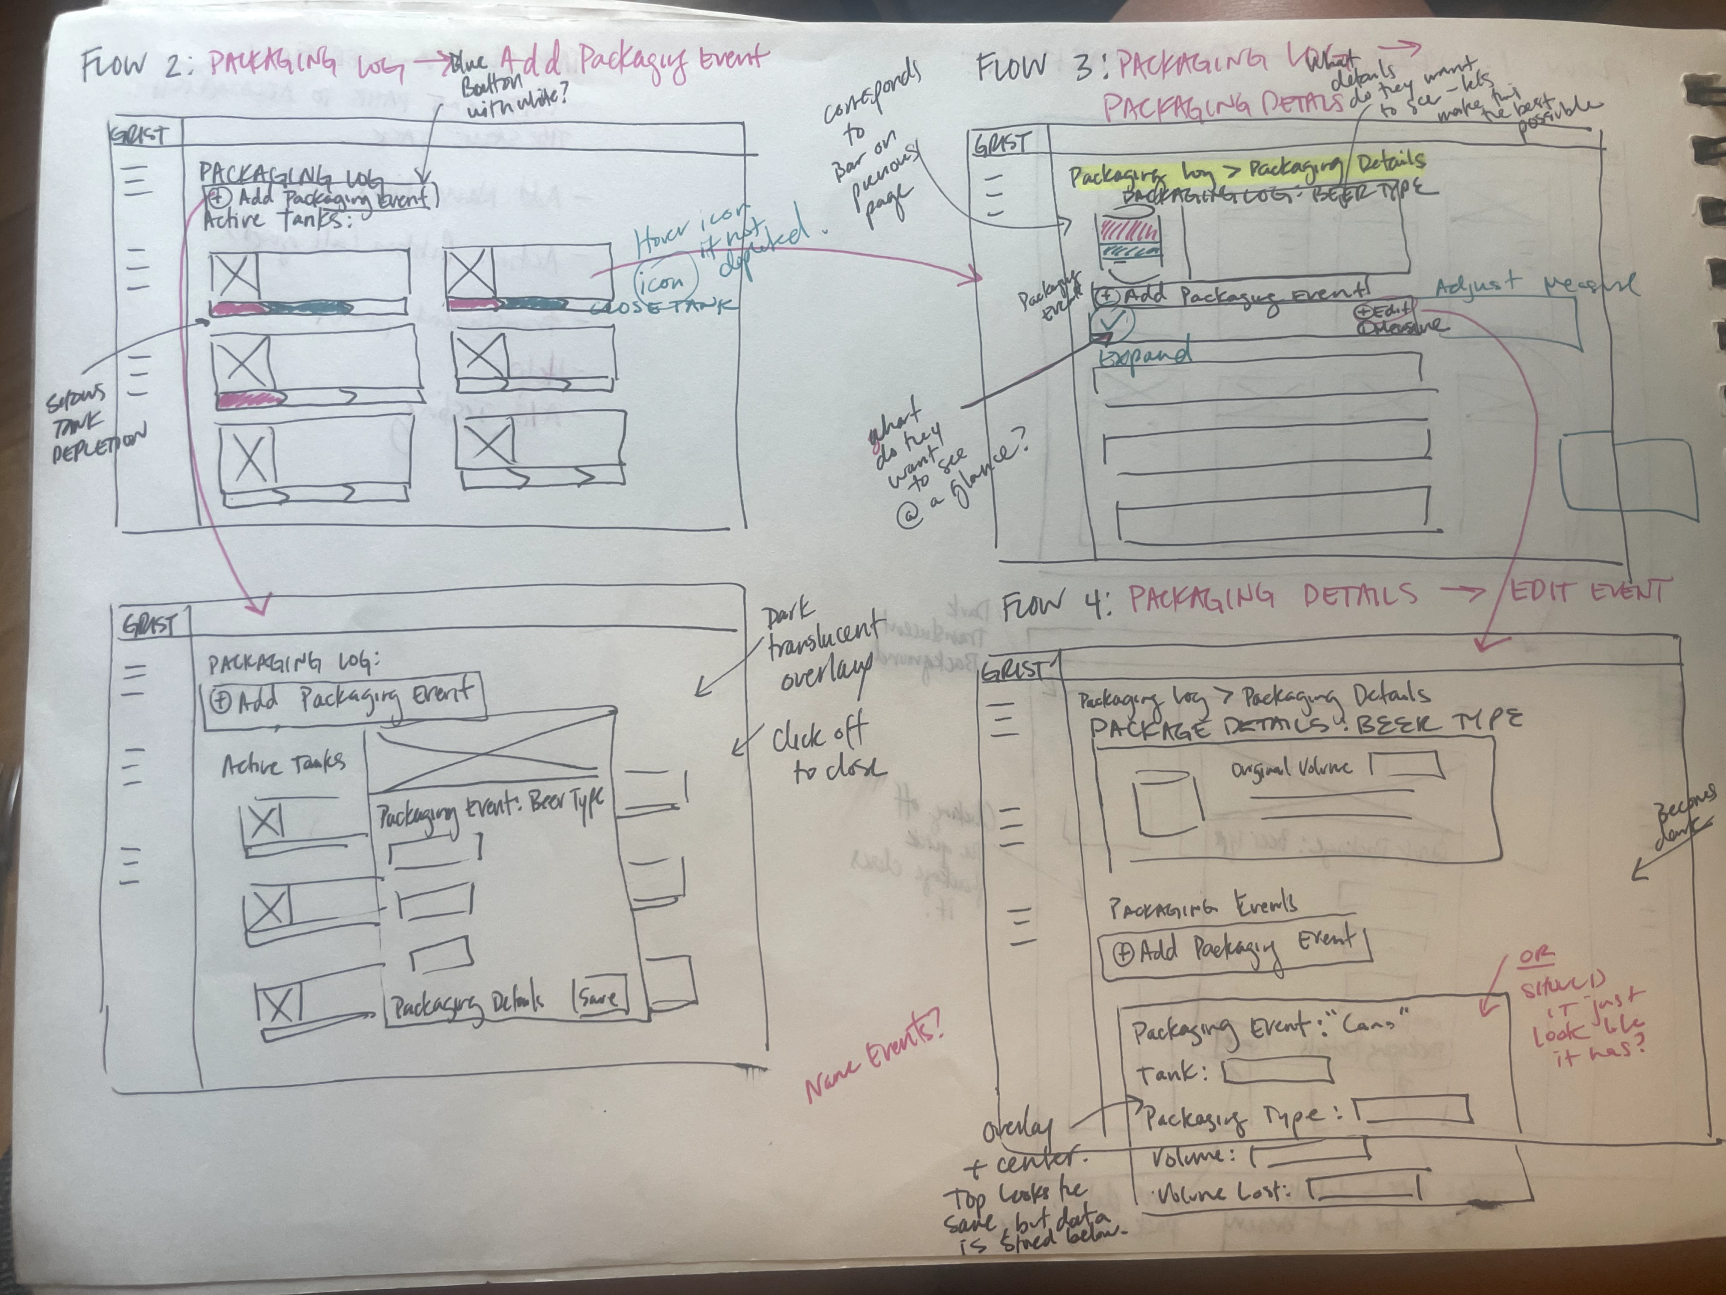


After creating the mid-fidelity frames shown above, we took our ideas back to users to get feedback on the new features. We conducted four interviews with the original research participants over Zoom.

Overall, users loved the new capabilities of the packaging feature. They enjoyed the interface design noting that it was more "user friendly and intuitive." Additionally, they loved the flexibility of being able to create and edit packaging events from the Cellar Overview. And, as always, user testing left us with some great takeaways for improvement.


.png)

.png)